Research Model
|
My digital history project takes on a quantitative approach. Specifically, I based this project on a correlational research model. I use statistical data to find a correlational relationship between two variables.
In the case of this project, I study newspaper circulation statistics to find a relationship between the number of newspapers sold and the growing success of William Randolph Hearst’s newspaper empire. |

|
Some of the questions that guided my research include:
- Did Hearst buy any newspaper, or did he specifically buy out newspapers that were not very successful? If it is the latter, did buying these newspapers increase their daily circulation?
- Is there a correlation between the newspapers he purchased and their locations?
Collecting Data
|
I collected my data from archived newspaper directories that were available through the Library of Congress website.
I originally planned to research the daily circulation statistics for Hearst-owned newspapers between 1887 and 1931. However, one of the limitations I found in my research was that the archived directories only go up to 1925, leaving any statistics from 1926 and onwards unavailable. As a result, I had to omit one of Hearst’s newspapers from my datasets since it was established in 1931. For each of Hearst’s newspapers, I decided to measure the circulation statistics over the course of ten years. The starting year will be the year that a newspaper was brought out by Hearst or the year after a newspaper was established in Hearst’s name. Due to the limitations of my data sources, only seven of the twenty-three newspapers could be measured over a ten-year period. From here, I decided to separate my datasets into two categories: complete circulation statistics and incomplete statistics. The complete statistics represent newspapers that can be measured in a ten-year period, and the incomplete statistics represent those that are measured in less than ten years. These two types of datasets measure the newspaper circulation data. In addition, I have also developed a third dataset, which organizes the latitude and longitude coordinates of cities that Hearst’s newspapers were located in. |
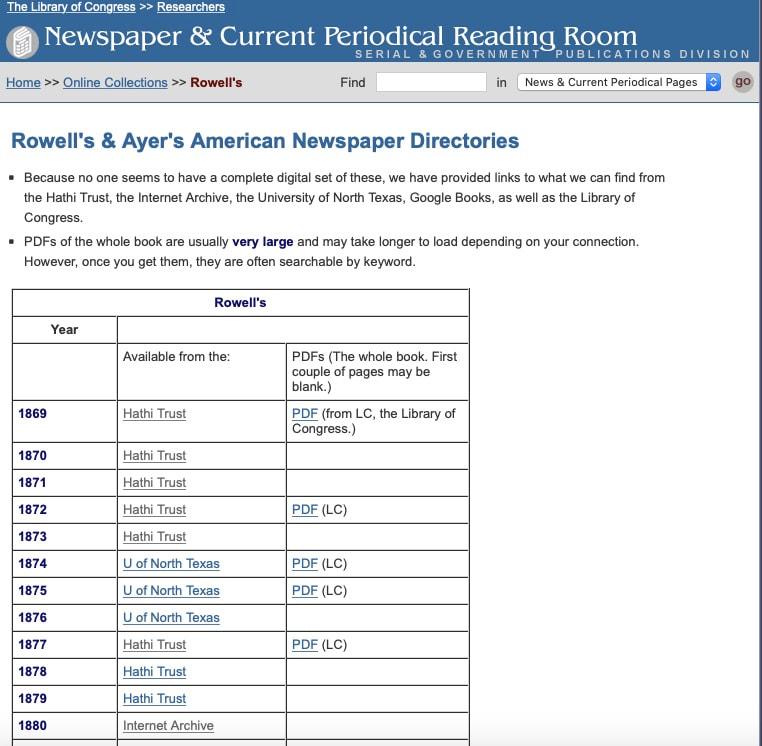
Newspaper directories available on the Library of Congress website.
|
|
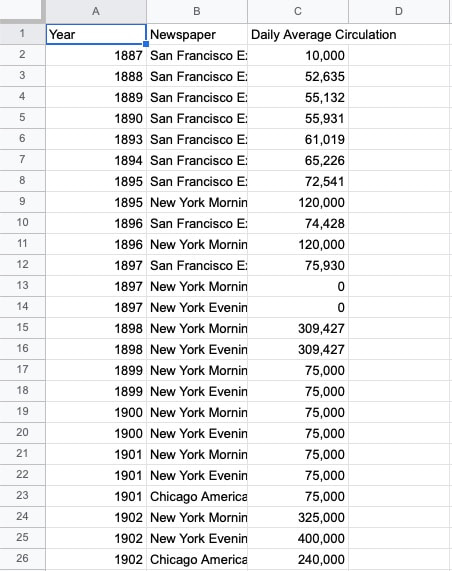
Complete Circulation Statistics
|
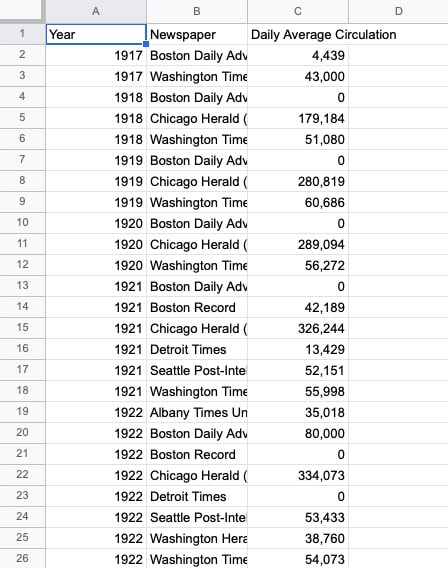
Incomplete Circulation Statistics
|
Data Visualization
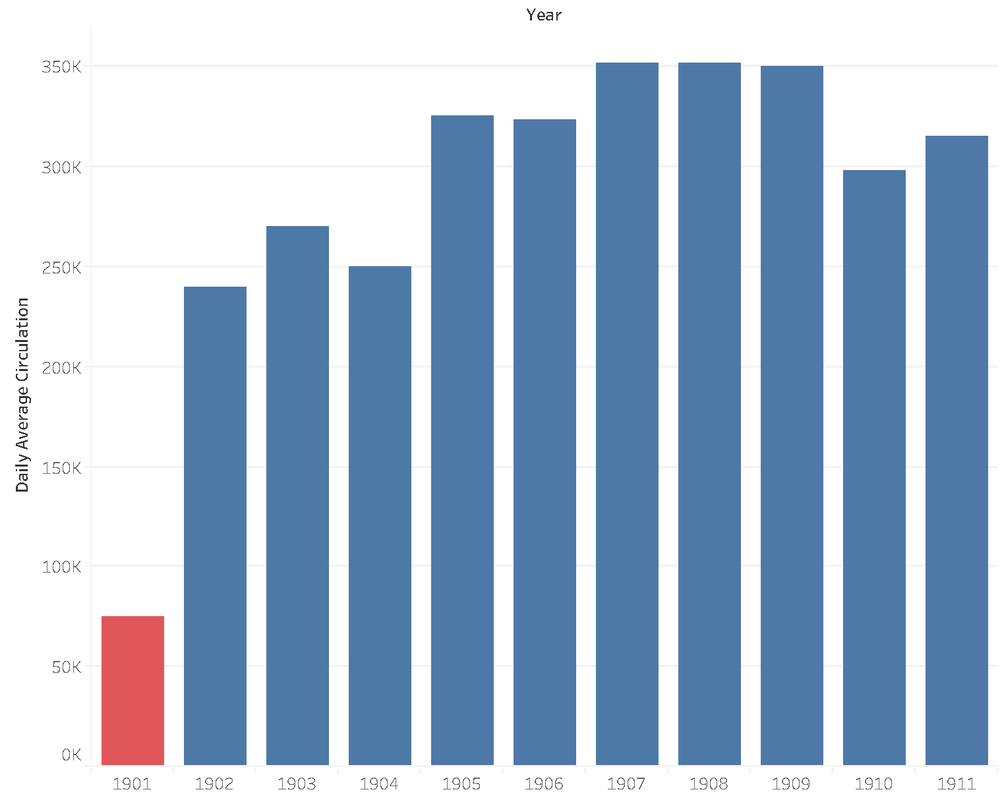
When it comes to visualizing my data, I used Tableau and Carto. With Tableau, I have created bar graphs for each of the newspapers researched. The y-axis represents the circulation numbers and the x-axis represents the years. I will observe any trends in these graphs and analyze whether or not Hearst was able to greatly increase newspaper circulation numbers.
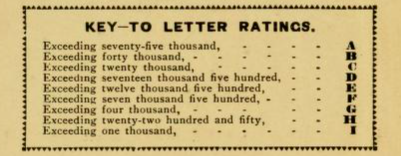
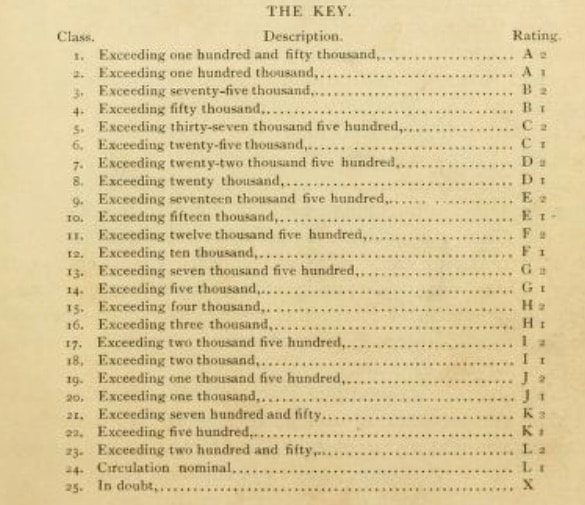
One of the limitations to the visualization of my data is that some of the statistics in my datasets are not exact values. When it came to analyzing the data found in the newspaper directories, I noticed that some years did not report exact numbers, but rather relied on letter ratings. These ratings indicated a rough estimate of how many newspapers were sold (ex: an ‘A’ rating in Rowell’s American Newspaper Directory indicates that a newspaper sold over 75,000 copies).
One of the limitations to the visualization of my data is that some of the statistics in my datasets are not exact values. When it came to analyzing the data found in the newspaper directories, I noticed that some years did not report exact numbers, but rather relied on letter ratings. These ratings indicated a rough estimate of how many newspapers were sold (ex: an ‘A’ rating in Rowell’s American Newspaper Directory indicates that a newspaper sold over 75,000 copies).
|
|
Two types of rating systems found in various editions of Rowell's American Newspaper Directory.
|
For these values, I decided to have them represented by a different color on my bar graphs. Most of the graphs will be colored blue, but any bars representing these letter ratings will be colored in red.
|
|
|
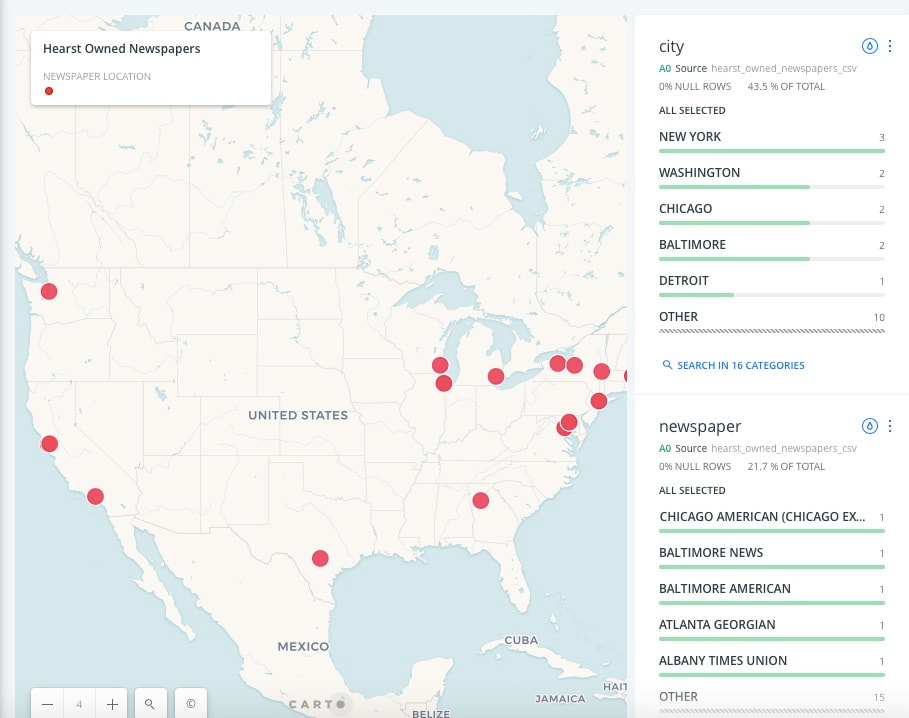
I used Carto to map out the locations of some of Hearst’s newspapers. Initially, I planned to have dots pinpoint these locations, with some of them appearing bigger depending on how many newspapers were established in a particular city.
However, since Carto relies on numerical data, it could not recognize the newspapers as a numeric value. Instead, I decided to include widgets on my Carto map. Widgets will allow viewers to access various information about the locations on the map. |
|
|
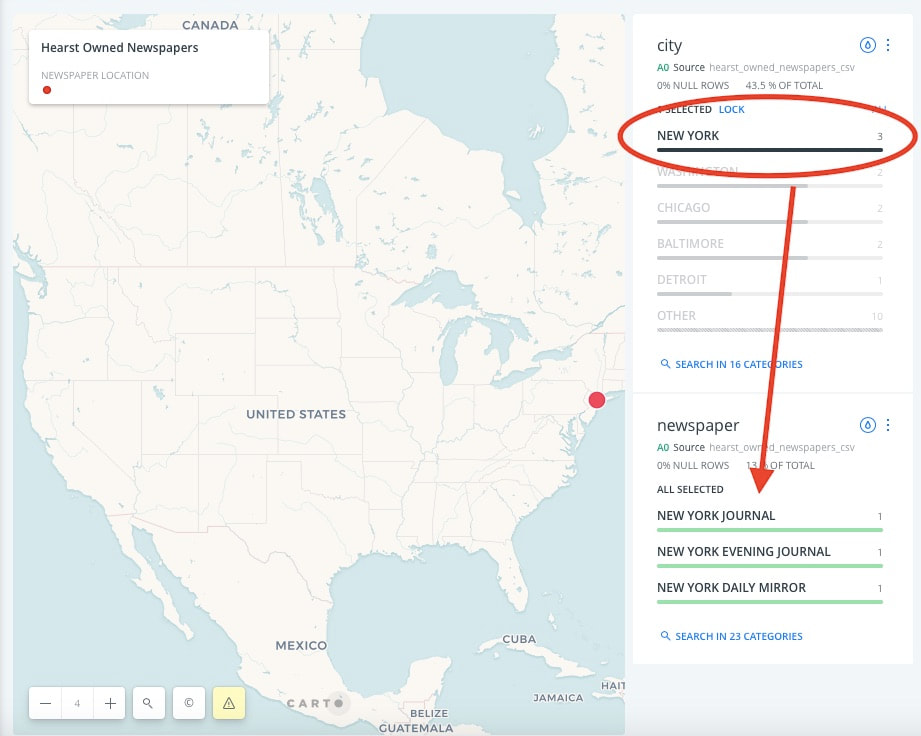
In the case of my project, my Carto map includes widgets pertaining to the cities and the newspapers listed. One could click on a city listed under the “city” widget and see the names of the newspapers found in that particular city under the “newspaper” widget below.
|
|
